 |
| Groundhog Day Blizzard of 2011. Credit: NOAA |
The National Climatic Data Center's (NCDC) latest Billion Dollar Disaster Report finds the US has racked up more mega-expensive natural disasters in 2011 than ever before.
So far we've suffered more than five times the huge disasters typical at this time of year. Already damage costs have reached nearly $32 billion.
Compare that to the first half of the average year—prior to the onset of "big" hurricane season—between 1980 and 2010, where disaster costs typically run $6 billion.
 |
| Billion-dollar-plus natural disasters between 1980 and 2010, using a GNP inflation index. |
The normalized losses (that is, the numbers adjusted for the GNP inflation index) add up to more than $725 billion for those 99 disasters.
So far, nine billion-dollar disasters have befallen the US this year. Here's the NCDC list:
- Groundhog Day Blizzard Jan 29-Feb 3. Insured losses were greater than $1.1 billion. Total losses (insurance, state and local snow removal, business interruption) were greater than $3.9 billion. Thirty-six deaths.
 |
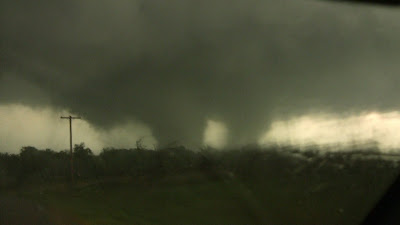
| A picture of the EF3 tornado that struck Tushka, Oklahoma, 14 April 2011. Credit: Gabe Garfield and Marc Austin via NOAA. |
- Midwest/Southeast Tornadoes April 4-5. An estimated 46 tornadoes caused more than $1.4 billion insured losses, total losses greater than $2 billion, 9 deaths.
- Southeast/Midwest Tornadoes April 8-11. An estimated 59 tornadoes caused more than $1.5 billion insured losses, total losses greater than $2.2 billion, numerous injuries, no known deaths.
- Midwest/Southeast Tornadoes April 14-16. An estimated 160 tornadoes caused more than $1.7 billion insured losses, total losses greater than $2 billion, 38 deaths.
- Southeast/Ohio Valley/Midwest Tornadoes April 25-30. An estimated 305 tornadoes caused somewhere between $3.7 to $5.5 billion (the numbers are still being accounted), total losses approaching $10 billion, 320 deaths.
- Midwest/Southeast Tornadoes May 22-27. An estimated 180 tornadoes caused between $4 and $7 billion insured losses (the numbers are still being accounted), total losses may exceed $7.0 billion, 172 deaths—including the EF-5 tornado that struck Joplin, MO, killing 141, the deadliest single tornado in the US since record-keeping began.
 |
| Wildfires in Texas as of 30 April 2011. At this point more than two million acres/809,371 hectares had already burned. Credit: NASA Earth Observatory, image created by Jesse Allen. |
- Texas Drought and Wildfires, Spring-Summer 2011: drought and wildfires across Texas, New Mexico, and western Oklahoma racked up fighting/suppression costs of about $1 million a day. Total losses to agriculture and cattle were estimated between $1.5 and $3 billion, as of 16 June. Expenses are likely to rise as the drought continues.
 |
| This map depicts rainfall for the Midwest from April 19 to 25, when totals ranged from 150 millimeters/5.9 inches to greater than 525 millimeters/20.7 inches, prompting major flooding. Credit: NASA Earth Observatory, image by Jesse Allen. |
- Mississippi River flooding Spring-Summer 2011 Estimated economic loss ranges from $2 to 4 billion. Below are more detailed preliminary stats—the floods are still unfolding—as of 16 June:
- $500 million loss to agriculture in Arkansas
- $320 million in damage to Memphis, Tennessee
- $800 million loss to agriculture in Mississippi
- $317 million loss to agriculture and property in Missouri's Birds Point-New Madrid Spillway
- $80 million loss for the first 30 days of flood-fighting efforts in Louisiana
The Missouri River floods have not made it onto this list, since their onset was near the end of the compilation period.
The technical report, A Climatology of 1980-2003 Extreme Weather and Climate Events, by Tom Ross and Neal Lott, is illuminating. Here are some highlights (bold emphasis is mine):
The technical report, A Climatology of 1980-2003 Extreme Weather and Climate Events, by Tom Ross and Neal Lott, is illuminating. Here are some highlights (bold emphasis is mine):
- In twenty of the past twenty-four years, the U.S. has experienced at least one weather-related billion-dollar disaster.
- The only years without at least one billion-dollar disaster were 1981, 1982, 1984 and 1987.
- Since 1988, at least one disaster occurred each year, with only one such event in 1988 and 1990, and seven billion-dollar events in 1998. Two of the 1998 disasters were caused by hurricanes.
- Overall, hurricanes and tropical storms account for 16 of the 58 events and 28% of the monetary losses (normalized to 2002).
- The ten major droughts/heatwaves which have occurred since 1980 account for the largest percentage (42%) of weather-related monetary losses.
The technical report concludes:
Although some studies suggest that trends such as population increases, population shifts into higher risk areas, and increasing wealth have been the key factors in weather related disasters (as opposed to historical trends in the frequency or strength of such events), there is evidence that climate change may affect the frequency of certain extreme weather events. An increase in population and development in flood plains, along with an increase in heavy rain events in the U.S. during the past fifty years, have gradually increased the economic losses due to flooding. If the climate continues to warm, the increase in heavy rain events is likely to continue. While trends in extratropical cyclones are not clear, there are projections that the incidence of extreme droughts will increase if the climate warms throughout the 21st century.
 |
 |
| Credit: the National Weather Service's Climate Prediction Center |
If you're wondering what disasters might be delivered in the next quarter, check out the maps and the legend, above, for forecasts of temperature and precipitation anomalies through the end of October 2011. Hurricanes not included.


0 comments
Post a Comment